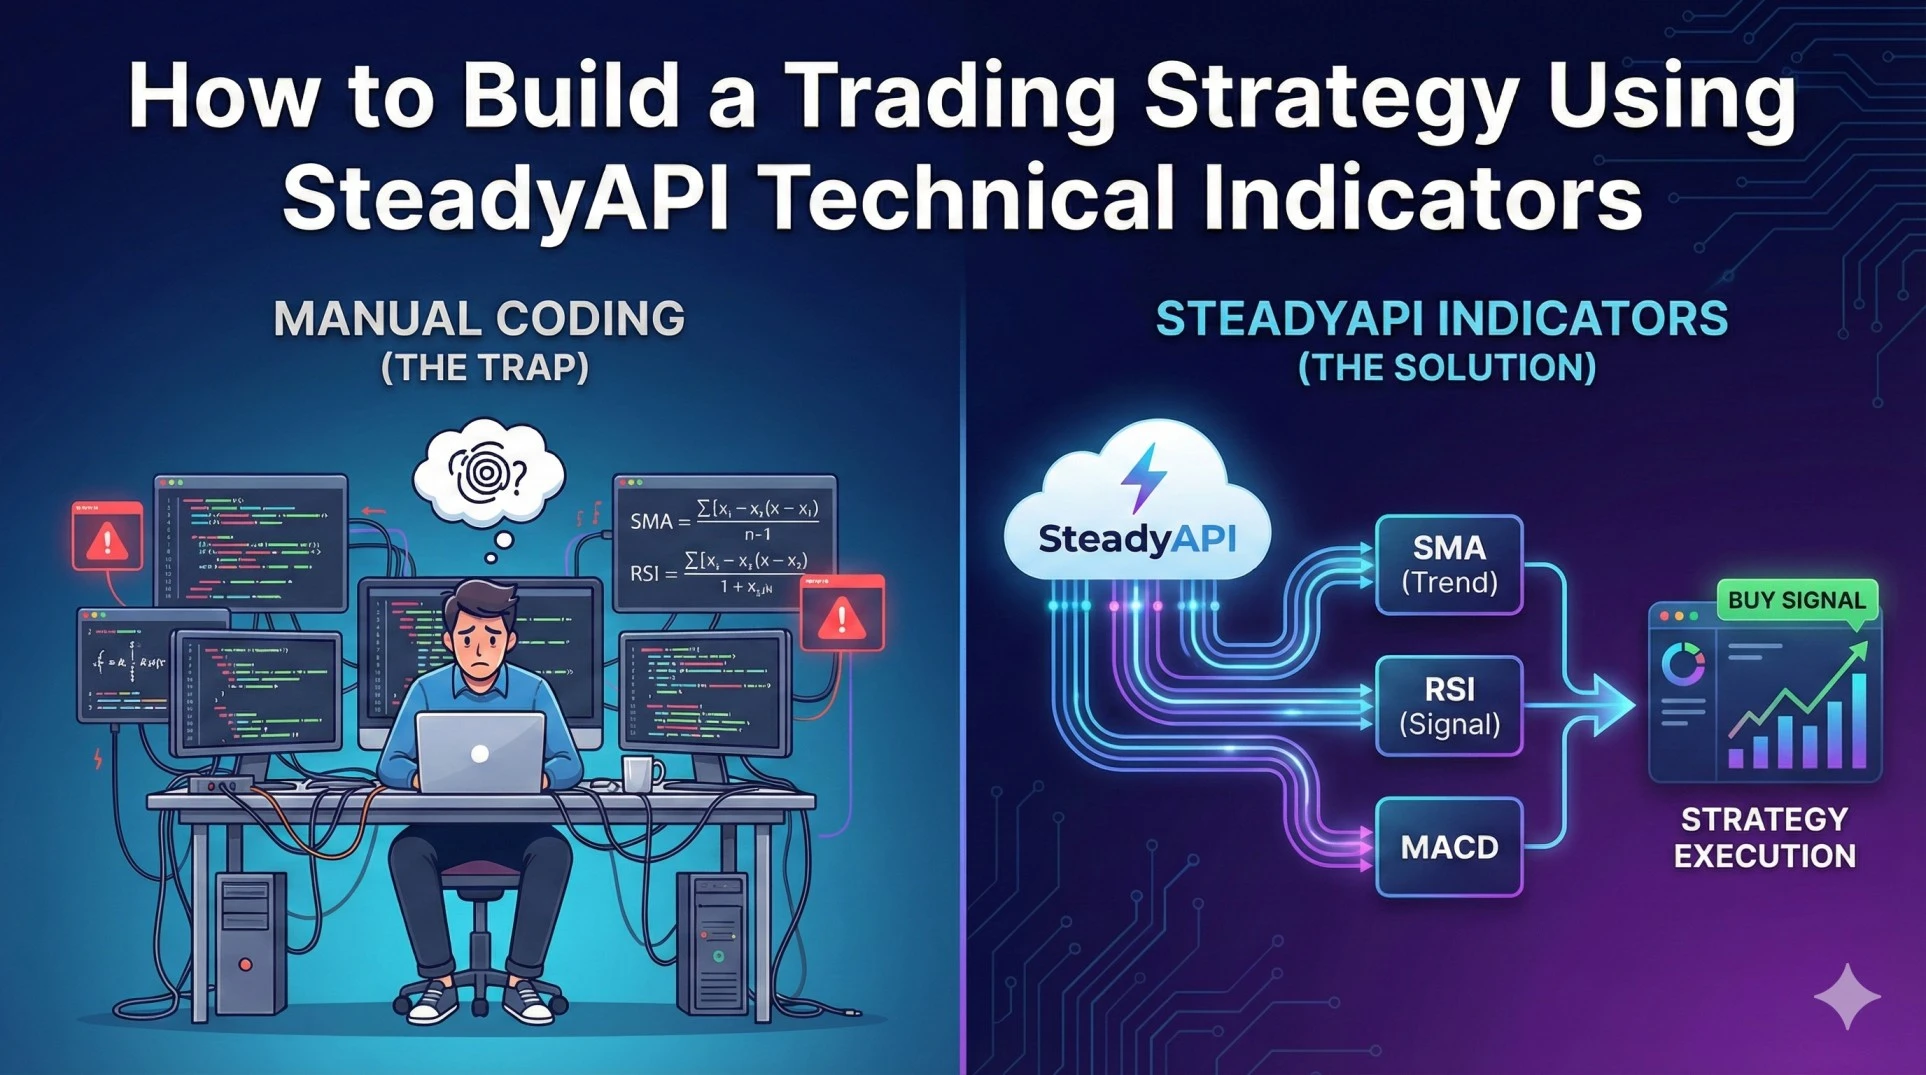
Let’s be honest: writing your own functions to calculate Moving Averages or RSI is a rite of passage for fintech developers, but it’s also a massive waste of time in production. You have to handle edge cases, manage rolling windows, and pray your math aligns with the exchange's data.
If you’re building a trading bot, a dashboard, or an alert system, you shouldn't be bogging down your CPU calculating indicators. You should be offloading that math to an API so you can focus on the logic that actually makes money.
In this guide, we’re going to build a simple "Dip Buyer" strategy using Python. We’ll use SteadyAPI to fetch the pre-calculated math for us.
Obtain API key
The Strategy:
Trend Filter: We only look at stocks where the price is above the 50-day Simple Moving Average (SMA). This ensures we are in an uptrend.
Entry Signal: We buy if the Relative Strength Index (RSI) drops below 30 (Oversold).
Here is how to implement this without writing a single line of mathematical formula code.
Prerequisites
- Python installed.
- A SteadyAPI Key
- requests library (pip install requests).
Step 1: The Setup
First, let's set up our base configuration. We need the base URL and our headers.
import requests
import json

BASE_URL = 'https://api.steadyapi.com/v1/markets/indicators'
HEADERS = {
  'Authorization': 'Bearer {YOUR_AUTH_KEY}',
  'Accept': 'application/json'
}

TICKER = 'AAPL'
INTERVAL = '1d' # Daily timeframe
Step 2: Fetching the SMA (The Trend)
We need the Simple Moving Average to determine the overall trend direction. Instead of fetching 50 days of historical price data and iterating through it, we hit the SMA endpoint.
Documentation:
SteadyAPI Docs: SMA Endpoint
We will request a 50-period SMA based on the close price.
def get_sma(ticker, interval, period):
    url = f"{BASE_URL}/sma"
    params = {
        'ticker': ticker,
        'interval': interval,
        'series_type': 'close',
        'time_period': period,
        'limit': '1' # We only need the most recent value
    }

    try:
        response = requests.get(url, headers=HEADERS, params=params)
        response.raise_for_status()
        data = response.json()

        # Assuming the API returns the most recent calculation in the body
        # Note: Adjust parsing based on exact JSON return structure
        return float(data['body'][-1]['value'])
    except Exception as e:
        print(f"Error fetching SMA: {e}")
        return None

current_sma = get_sma(TICKER, INTERVAL, '50')
print(f"Current SMA (50): {current_sma}")
Example Response Payload:
The API handles the calculation and returns clean data.
{
  "meta": {
    "symbol": "AAPL",
    "indicator": "SMA",
    "period": 50
  },
  "body": [
    {
      "timestamp": 1706745600,
      "value": 185.38
    }
  ]
}
Step 3: Fetching the RSI (The Trigger)
Now we need to know if the asset is oversold. Manually coding RSI requires calculating average gains and losses over a period—it's messy. SteadyAPI does this in one call.
Documentation:
SteadyAPI Docs: RSI Endpoint
Standard RSI uses a 14-period lookback.
def get_rsi(ticker, interval, period):
    url = f"{BASE_URL}/rsi"
    params = {
        'ticker': ticker,
        'interval': interval,
        'series_type': 'close',
        'time_period': period, # Standard is 14
        'limit': '1'
    }

    try:
        response = requests.get(url, headers=HEADERS, params=params)
        response.raise_for_status()
        data = response.json()
        return float(data['body'][-1]['value'])
    except Exception as e:
        print(f"Error fetching RSI: {e}")
        return None

current_rsi = get_rsi(TICKER, INTERVAL, '14')
print(f"Current RSI (14): {current_rsi}")
Step 4: Fetching Real-Time Price
To compare against our SMA, we need the current price.
Documentation:
SteadyAPI Docs: Real-Time Quote Endpoint
def get_current_price(ticker):
    url = 'https://api.steadyapi.com/v1/markets/quote'
    params = {'ticker': ticker, 'type': 'STOCKS'}

    response = requests.get(url, headers=HEADERS, params=params)
    data = response.json()

    # Parsing the primaryData section from the response
    price_str = data['body']['primaryData']['lastSalePrice'].replace('$', '')
    return float(price_str)

current_price = get_current_price(TICKER)
print(f"Current Price: {current_price}")
Step 5: The Logic (Execution)
Now we simply compare the values. This script could run on a cron job every morning (for daily intervals) or every minute (for day trading logic).
def run_strategy(ticker):
    print(f"--- Analyzing {ticker} ---")

    price = get_current_price(ticker)
    sma_50 = get_sma(ticker, '1d', '50')
    rsi_14 = get_rsi(ticker, '1d', '14')

    if not price or not sma_50 or not rsi_14:
        print("Insufficient data to analyze.")
        return

    # Strategy Logic
    is_uptrend = price > sma_50
    is_oversold = rsi_14 < 30

    print(f"Price: {price} | SMA50: {sma_50} | RSI: {rsi_14}")

    if is_uptrend and is_oversold:
        print("✅ SIGNAL: BUY (Dip in Uptrend detected)")
    elif rsi_14 > 70:
        print("⚠️ SIGNAL: CAUTION/SELL (Overbought)")
    else:
        print("❌ SIGNAL: HOLD/WAIT")

# Execute
run_strategy('AAPL')
Use Cases for this Setup
By offloading the "heavy lifting" of technical analysis to SteadyAPI, you open up several possibilities:
High-Volume Screeners: You could loop through the entire S&P 500 in minutes, checking for this specific setup without calculating 500 different rolling windows locally.
Discord/Slack Bots: Create a bot that users can query (e.g., !analyze TSLA) that instantly fetches these indicators and returns a sentiment summary.
Paper Trading Algorithms: Connect this logic to a paper trading account. Since the math is consistent via the API, debugging your strategy becomes significantly easier.
Conclusion
Technical analysis doesn't have to be a mathematical headache. By using endpoints like /indicators/sma and /indicators/rsi, you ensure your data is consistent and your application remains lightweight.
For more advanced strategies, check out the full list of technical indicators available, including MACD, Bollinger Bands (via BBANDS), and ADX.
Learn more or explore other endpoints:
SteadyAPI Stock and Options Data API