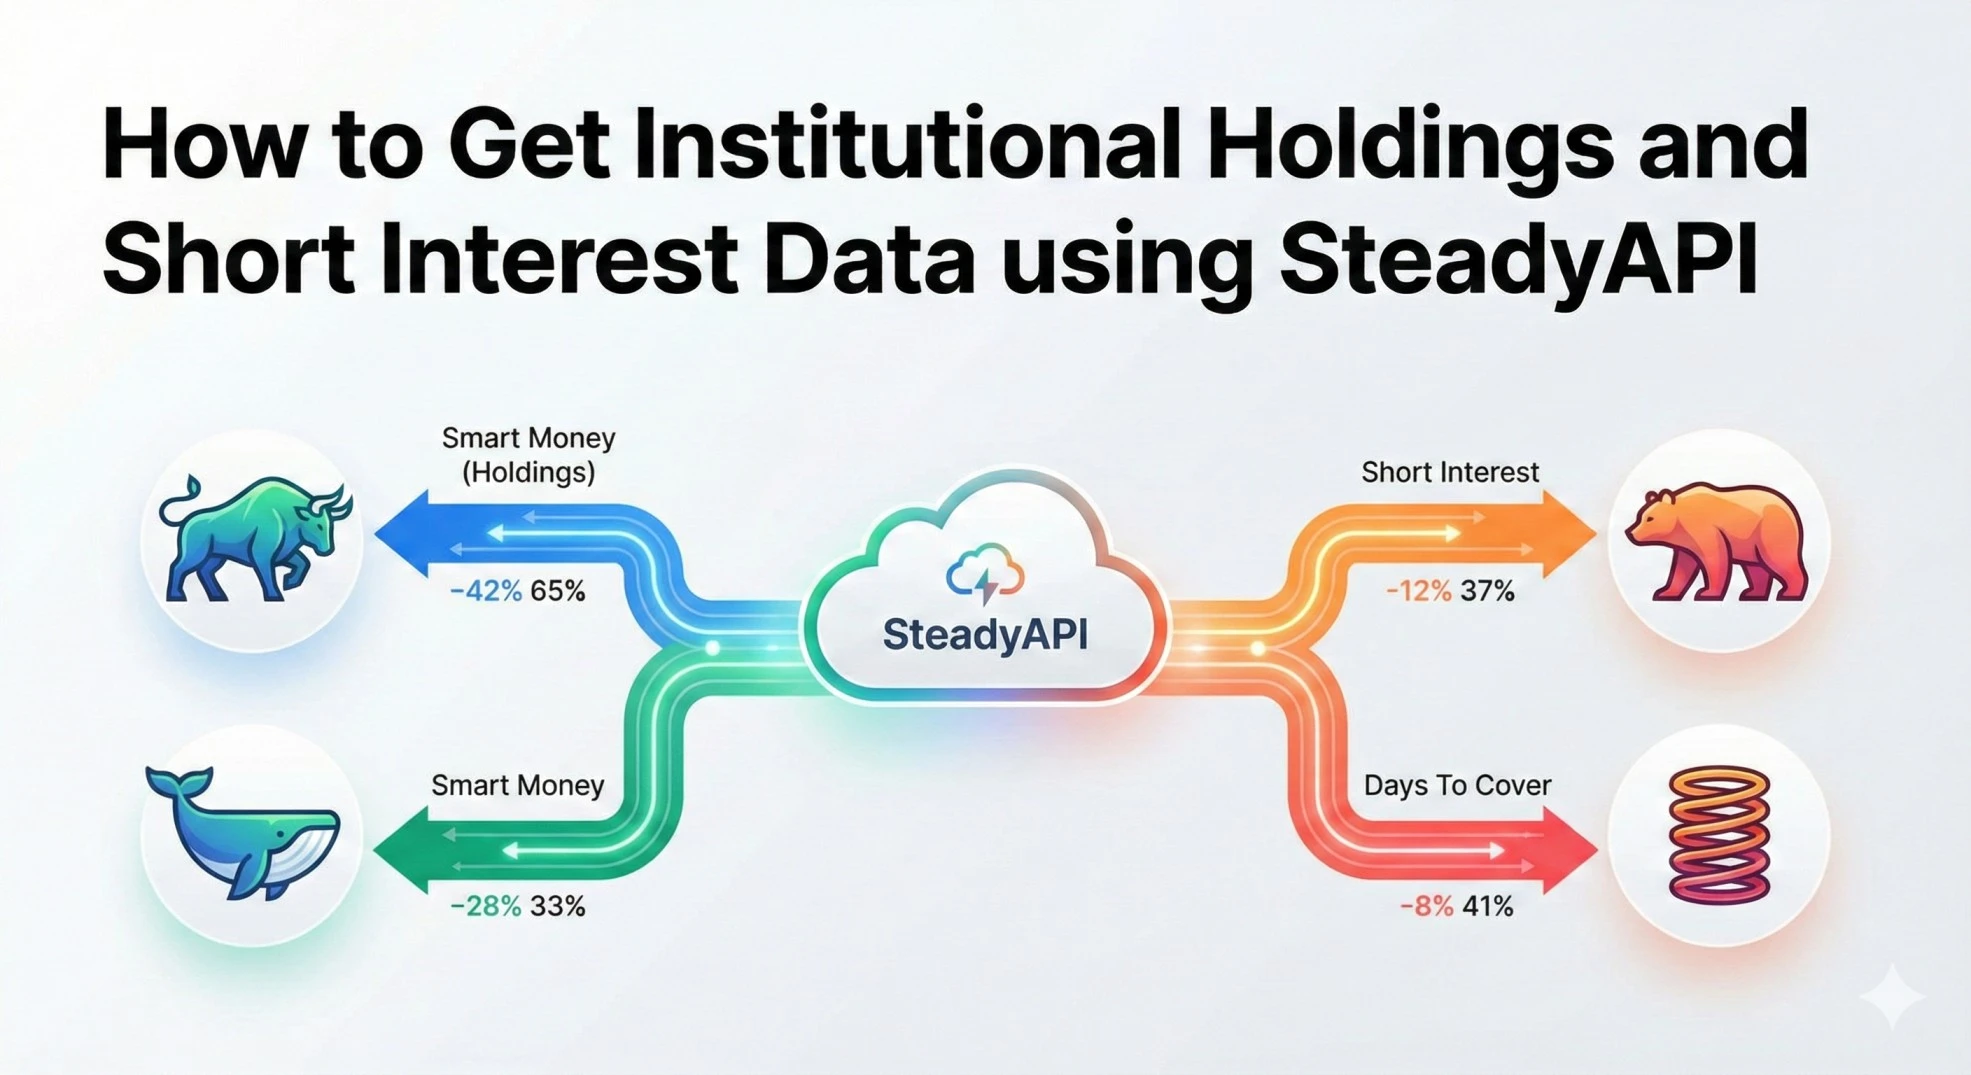
Understanding market sentiment requires analyzing not just price action, but the positioning of major market participants. On one side, you have Smart Money, institutional investors like hedge funds and pension funds, whose accumulation often signals long-term confidence. On the other side, you have short sellers betting against a stock. By combining these two datasets, developers can build powerful tools to identify potential short squeezes, track institutional accumulation, or flag bearish trend reversals.
To access these endpoints, you must obtain an API key:
Get your API key
This guide explains how to retrieve Short Interest and Institutional Holdings data using SteadyAPI to gauge market sentiment programmatically.
The Endpoints
We will utilize two specific v2 endpoints to gather this intelligence. The Short Interest endpoint provides a historical view of short positions, settlement dates, and liquidity metrics. The Institutional Holdings endpoint offers a breakdown of ownership percentages, active positions, and recent buying or selling activity by major firms.
Institutional Holdings Documentation
Detailed Parameter Analysis
To successfully query these endpoints, you must understand the required and optional parameters.
Ticker Parameter
Both endpoints require the ticker parameter. This is the symbol of the company you wish to analyze (e.g., TSLA, GME, AAPL).
Type Parameter (Institutional Holdings)
The Institutional Holdings endpoint accepts a type parameter that filters the specific kind of ownership data returned.
- TOTAL
Returns the aggregate holdings data and general ownership summary. - INCREASED
Filters for institutions that have recently added to their positions. - DECREASED
Filters for institutions that have reduced their positions. - NEW
Returns institutions that have opened a position for the first time in the recent reporting period. - SOLDOUT
Returns institutions that have completely exited their positions.
Python Example
The following script demonstrates how to fetch both short interest data and total institutional holdings for Tesla (TSLA) to analyze the current sentiment battleground between shorts and institutions.
import requests
import json

# Configuration
api_key = "YOUR_ACCESS_TOKEN"
ticker_symbol = "TSLA"
base_url = "https://api.steadyapi.com/v2/markets/stock"

headers = {
    "Authorization": f"Bearer {api_key}",
    "Accept": "application/json"
}

def get_market_sentiment(ticker):
    # 1. Fetch Short Interest Data
    short_url = f"{base_url}/short-interest"
    short_params = {"ticker": ticker}

    short_response = requests.get(short_url, headers=headers, params=short_params)
    short_data = short_response.json()

    # 2. Fetch Institutional Holdings (Type: TOTAL)
    inst_url = f"{base_url}/institutional-holdings"
    inst_params = {
        "ticker": ticker,
        "type": "TOTAL"
    }

    inst_response = requests.get(inst_url, headers=headers, params=inst_params)
    inst_data = inst_response.json()

    # Output specific metrics
    print(f"--- Sentiment Analysis for {ticker} ---")

    if 'body' in short_data and len(short_data['body']) > 0:
        latest_short = short_data['body'][0]
        print(f"Settlement Date: {latest_short.get('settlementDate')}")
        print(f"Days To Cover: {latest_short.get('daysToCover')}")
        print(f"Short Interest: {latest_short.get('interest')}")

    if 'body' in inst_data:
        summary = inst_data['body'].get('ownershipSummary', {})
        pct_held = summary.get('SharesOutstandingPCT', {}).get('value', 'N/A')
        print(f"Institutional Ownership: {pct_held}")

# Execute
get_market_sentiment(ticker_symbol)
Understanding the Response
The API returns structured JSON data that requires specific parsing to extract actionable insights.
Short Interest Response Structure
The body array contains historical snapshots. The first item in the array is typically the most recent report.
{
  "body": [
    {
      "settlementDate": "01/12/2024",
      "interest": "101,263,039",
      "avgDailyShareVolume": "56,712,342",
      "daysToCover": 1.785556
    }
  ]
}
Institutional Holdings Response Structure
The ownershipSummary object provides high-level metrics, while activePositions details the flow of shares.
{
    "body": {
        "ownershipSummary": {
            "SharesOutstandingPCT": {
                "label": "Institutional Ownership",
                "value": "58.67%"
            }
        },
        "activePositions": {
            "rows": [
                {
                    "positions": "Increased Positions",
                    "holders": "1,938"
                }
            ]
        }
    }
}
Key Fields
- daysToCover
Found in the Short Interest response, this metric represents the number of days it would take all short sellers to cover their positions based on the average daily volume. A value over 10 is often considered a strong indicator of potential short squeeze conditions. - SharesOutstandingPCT
Found in the Institutional Holdings response, this indicates the percentage of the company's total shares currently held by institutions. High percentages (over 70 to 80 percent) suggest stability but may limit volatility, while low percentages might indicate an overlooked stock with room for growth. - settlementDate
Short interest data is not real-time. It is reported twice a month. This field confirms the recency of the data, which is critical for accurate analysis.
Practical Use Cases
Short Squeeze Detection Algorithms
By monitoring the daysToCover and interest fields, developers can flag stocks where short interest is spiking while the stock price remains resilient. If this correlates with an increase in institutional buying via the INCREASED type in holdings, it suggests a bear trap or potential squeeze scenario.
Following Big Bank Portfolio Changes
Using the NEW or SOLDOUT filters on the Institutional Holdings endpoint allows applications to track when major funds enter or exit positions completely. This data is essential for building copy-trading strategies or identifying sector rotation trends before they become obvious in price action.
Learn more or explore other endpoints:
SteadyAPI Stock and Options Data API