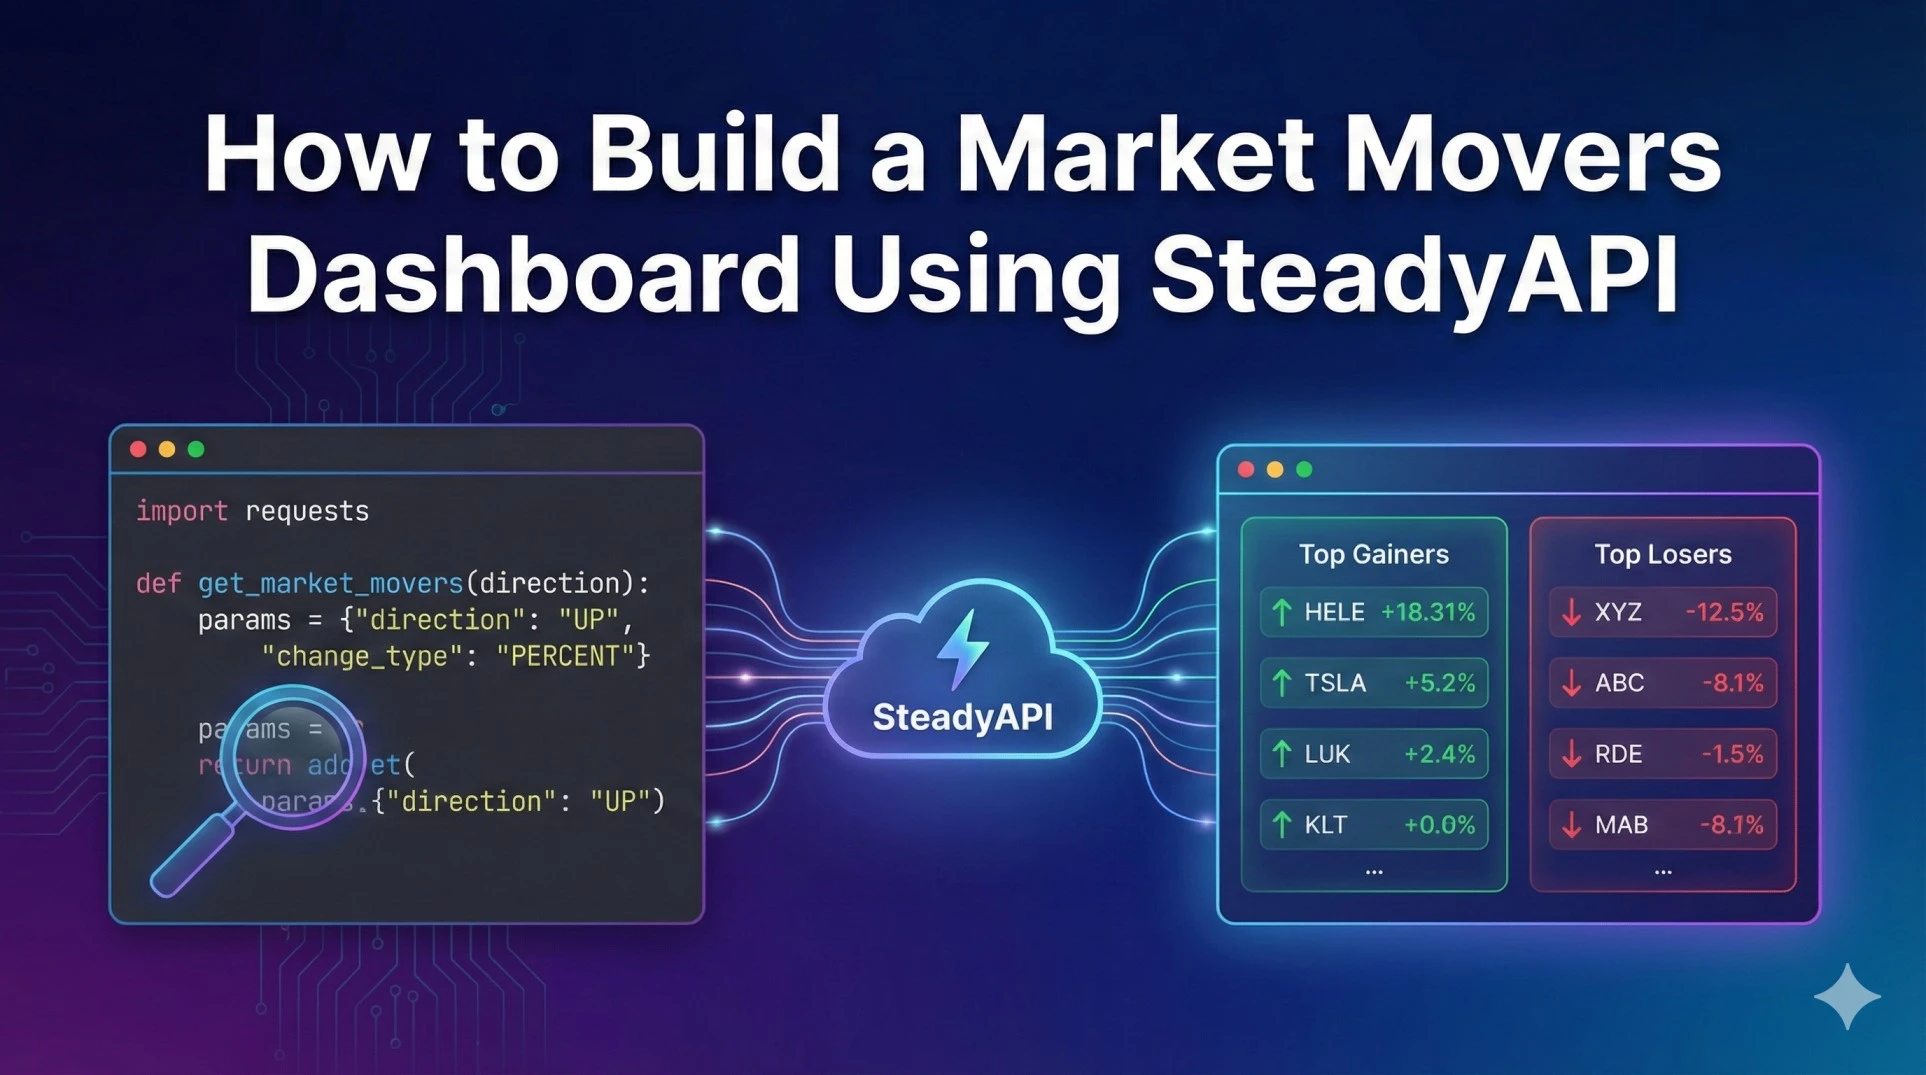
In the fast-paced world of trading, identifying volatility and momentum instantly is crucial. A Market Movers dashboard provides a real-time snapshot of the biggest winners, losers, and most active stocks, allowing traders and analysts to spot trends as they happen. By integrating SteadyAPI, developers can programmatically access this data to build dynamic financial tools that filter noise and focus on assets with significant price action.
Obtain API key:
Get your SteadyAPI key
The Endpoint
To retrieve this data, we use the GET /v2/markets/movers endpoint. This endpoint allows for flexible filtering based on price changes, percentage changes, and gap moves, providing a sorted list of assets based on your specific criteria.
Documentation:
SteadyAPI Market Movers Endpoint Documentation
Detailed Parameter Analysis
To effectively utilize this endpoint, you must configure specific parameters to define what constitutes a "mover" for your dashboard:
- change_type
This parameter dictates how the movement is calculated. You can selectPERCENTfor percentage-based moves (ideal for finding high volatility) orPRICEfor absolute dollar value changes. - direction
This controls whether you retrieve gainers or losers. Set this toUPto find top gainers orDOWNto identify top losers. - price_min
This optional string value filters results by a minimum stock price. This is particularly useful for filtering out penny stocks if your dashboard focuses on mid-to-large cap assets.
Python Example
The following script demonstrates how to fetch both the top gainers and top losers for the current session. It defines a helper function to query the API and prints a summary of the results.
import requests
import json

def get_market_movers(direction):
    url = "https://api.steadyapi.com/v2/markets/movers"

    # Configure parameters for the dashboard
    params = {
        "change_type": "PERCENT",  # Focus on % change
        "direction": direction,    # UP for gainers, DOWN for losers
        "price_min": "5",          # Filter out stocks under $5
        "page": "1"
    }

    headers = {
        "Authorization": "Bearer {YOUR_AUTH_KEY}"
    }

    try:
        response = requests.get(url, headers=headers, params=params)
        response.raise_for_status()
        return response.json()
    except requests.exceptions.RequestException as e:
        print(f"Error fetching data: {e}")
        return None

# Fetch Top Gainers
print("--- Top Gainers (Direction: UP) ---")
gainers = get_market_movers("UP")
if gainers and 'body' in gainers:
    for stock in gainers['body'][:5]: # Print top 5
        print(f"{stock['symbol']}: {stock['lastPrice']} ({stock['percentChange']})")

# Fetch Top Losers
print("\n--- Top Losers (Direction: DOWN) ---")
losers = get_market_movers("DOWN")
if losers and 'body' in losers:
    for stock in losers['body'][:5]: # Print top 5
        print(f"{stock['symbol']}: {stock['lastPrice']} ({stock['percentChange']})")
Understanding the Response
The API returns a JSON object containing metadata about the request and a body list of ticker objects.
{
  "meta": {
    "version": "v1.0",
    "status": 200,
    "copywrite": "https://steadyapi.com",
    "count": 20,
    "total": 200,
    "page": 1
  },
  "body": [
    {
      "symbol": "HELE",
      "symbolName": "Helen of Troy Ltd",
      "lastPrice": "73.79",
      "priceChange": "+11.42",
      "percentChange": "+18.31%",
      "volume": "2,418,808",
      "marketCap": "1,422,846"
    }
  ]
}
Key Fields
When building your dashboard, focus on these specific fields from the response body:
- lastPrice
The most recent trading price of the asset. This is essential for displaying current value. - percentChange
The percentage movement during the current session. This is the primary metric for ranking stocks on a momentum dashboard. - volume
The number of shares traded. High volume validates the strength of a price move; low volume moves may be less reliable. - symbol
The unique ticker identifier for the asset, used to link to further details or charts.
Practical Use Cases
Momentum Trading Bots
Developers can use this endpoint to automatically trigger buy or sell orders when a stock exceeds a specific percentage threshold within a set timeframe, automating breakout strategies.
Visual Heatmaps
The data can be mapped to a visual grid where the color indicates the direction (Green for UP, Red for DOWN) and the size of the block represents the volume or marketCap, giving users an instant view of market health.
Learn more or explore other endpoints:
SteadyAPI Stock and Options Data API