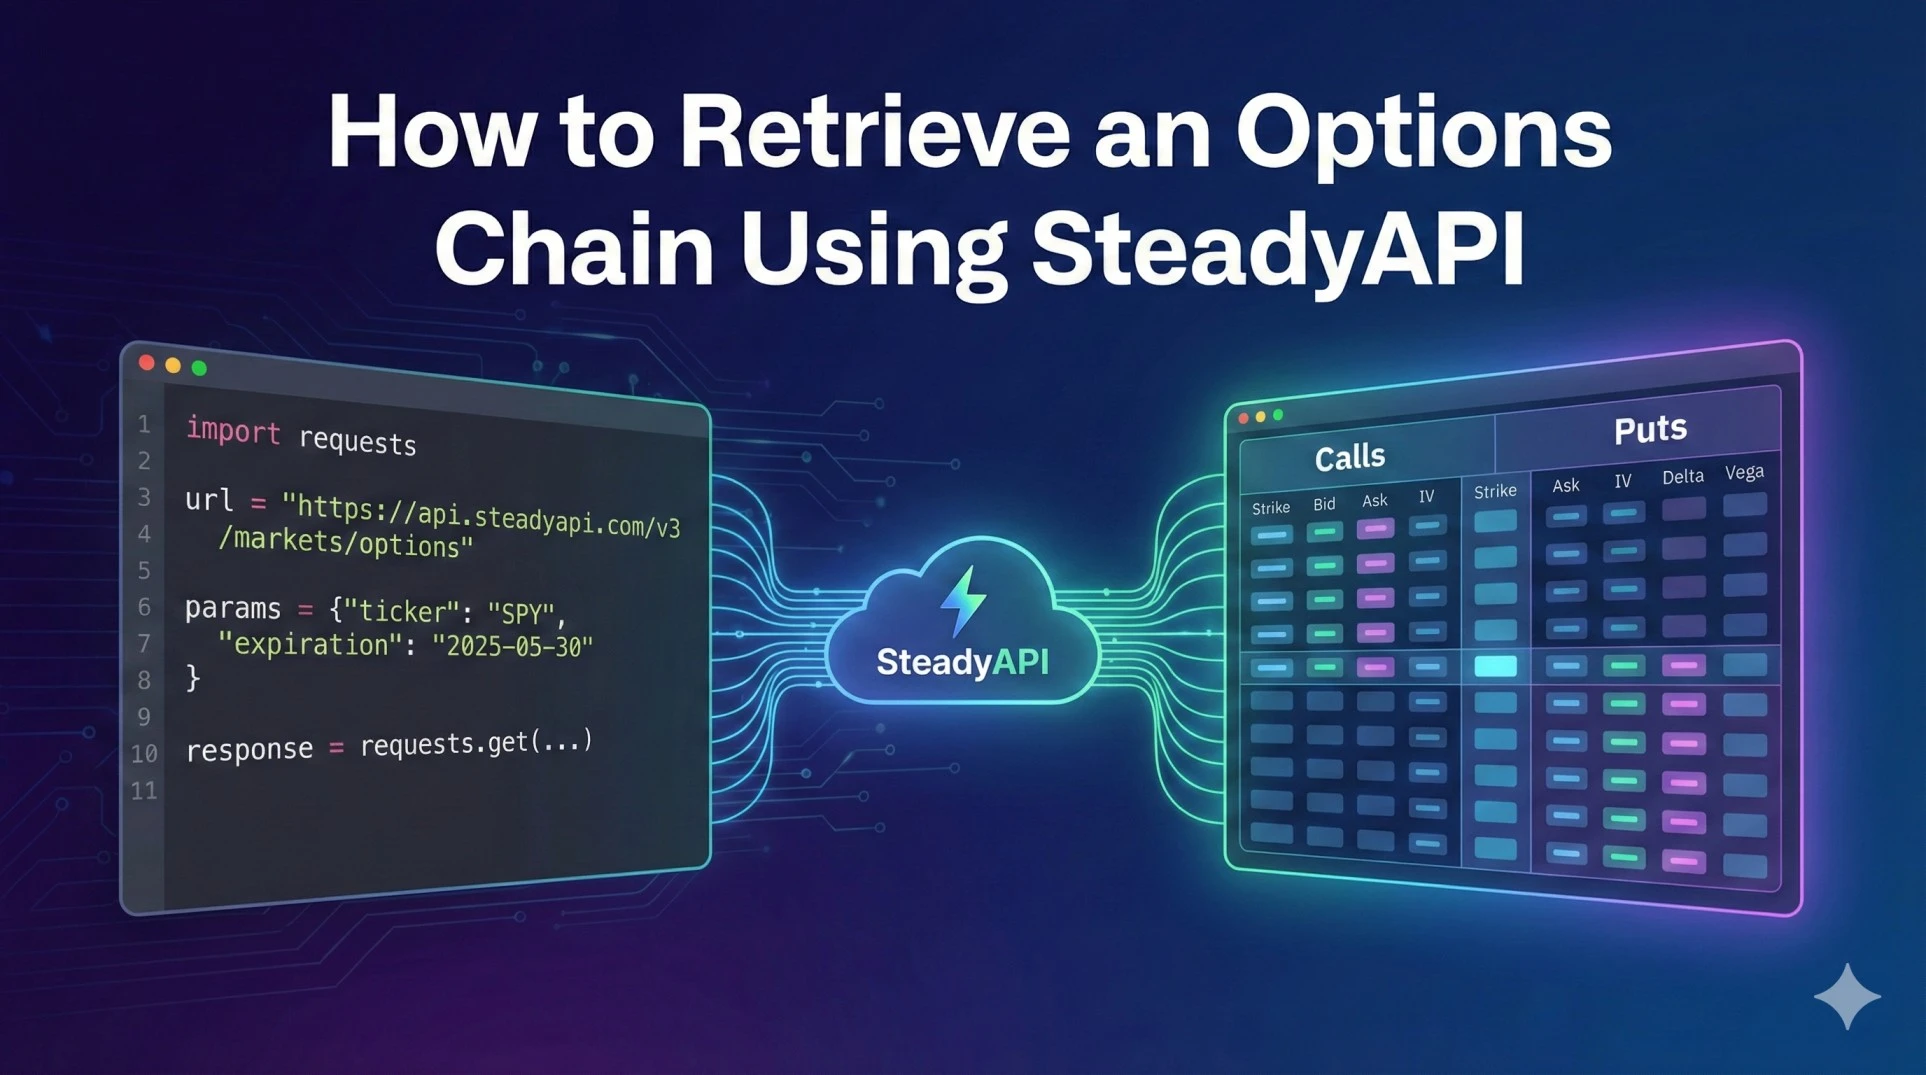
An Options Chain represents a comprehensive listing of all available option contracts for a specific security, categorized by expiration date. For quantitative traders and developers, accessing this data programmatically is crucial for building trading algorithms, risk management dashboards, and volatility analysis tools. Unlike standard price quotes, a robust options chain API must provide "Greeks" (Delta, Vega, Theta) and Implied Volatility (IV) to allow for sophisticated modeling of asset behavior.
Obtain API key:
Get your SteadyAPI key
The Endpoint
To access the full matrix of Calls and Puts for a specific underlying asset, utilize the GET /v3/markets/options endpoint. This V3 endpoint is the most recent iteration, optimized for granular data retrieval including real-time Greek calculations.
Documentation:
SteadyAPI Options Chain Endpoint Documentation
Detailed Parameter Analysis
To successfully query the options chain, you must provide specific query parameters.
- ticker
The symbol of the underlying asset. Examples includeSPY,AAPL, orTSLA. - expiration
The specific expiration date for the contracts you wish to retrieve, formatted as YYYY-MM-DD. If you do not know the available expiration dates, you can make a request with only the ticker; the meta object in the response will return a list of valid weekly and monthly expiration dates available for that asset.
Python Example
The following script demonstrates how to request the options chain for the SPY ETF expiring on May 30, 2025. It authenticates the request, fetches the data, and iterates through the response to separate Call and Put contracts.
import requests

url = "https://api.steadyapi.com/v3/markets/options"

# Replace with your actual API key
headers = {
    "Authorization": "Bearer {YOUR_AUTH_KEY}"
}

# Define the underlying asset and the specific expiration date
params = {
    "ticker": "SPY",
    "expiration": "2025-05-30"
}

response = requests.get(url, headers=headers, params=params)

if response.status_code == 200:
    data = response.json()

    # Process Calls
    print(f"--- Calls for {params['ticker']} ---")
    for call in data['body']['Call']:
        print(f"Strike: {call['strikePrice']} | Bid: {call['bidPrice']} | IV: {call['volatility']} | Delta: {call['delta']}")

    # Process Puts
    print(f"\n--- Puts for {params['ticker']} ---")
    for put in data['body']['Put']:
        print(f"Strike: {put['strikePrice']} | Bid: {put['bidPrice']} | IV: {put['volatility']} | Delta: {put['delta']}")
else:
    print(f"Error: {response.status_code} - {response.text}")
Understanding the Response
The API returns a JSON object containing a metadata section and a body divided into Call and Put arrays.
{
  "meta": {
    "version": "v3.0",
    "status": 200,
    "copywrite": "https://steadyapi.com",
    "expirations": {
      "weekly": ["2025-05-27", "2025-05-28"],
      "monthly": ["2025-06-20"]
    }
  },
  "body": {
    "Call": [
      {
        "symbol": "SPY|20250530|590.00C",
        "strikePrice": "590.00",
        "expirationDate": "05/30/25",
        "bidPrice": "4.96",
        "askPrice": "4.98",
        "volatility": "20.08%",
        "delta": "0.5518",
        "vega": "0.2120",
        "theta": "-0.7369"
      }
    ],
    "Put": [
      {
        "symbol": "SPY|20250530|590.00P",
        "strikePrice": "590.00",
        "bidPrice": "3.21",
        "askPrice": "3.23",
        "volatility": "17.88%",
        "delta": "-0.4438"
      }
    ]
  }
}
Key Fields
The V3 response includes critical data points for analysis:
- strikePrice
The price at which the option can be exercised. - bidPrice / askPrice
The current market price for the contract. - volatility
The Implied Volatility (IV) percentage. This is a forward-looking metric indicating the market's view of the likelihood of changes in a given security's price. - delta
Measures the rate of change of the option's price with respect to changes in the underlying asset's price. - vega
Measures the risk of the option position concerning changes in the volatility of the underlying asset. - theta
Measures the rate of decline in the value of an option due to the passage of time (time decay).
Practical Use Cases
Building an Option Pricing Model
By retrieving the strikePrice, expirationDate, and current premiums, developers can back-test Black-Scholes or Binomial pricing models against the live volatility and Greeks provided by the API to identify mispriced contracts.
Visualizing the Volatility Smile
You can plot strikePrice on the x-axis and volatility on the y-axis to visualize the "volatility smile" or skew. This analysis helps traders understand how the market is pricing OTM (Out of The Money) puts versus calls, indicating sentiment regarding potential market crashes or rallies.
Learn more or explore other endpoints:
SteadyAPI Stock and Options Data API