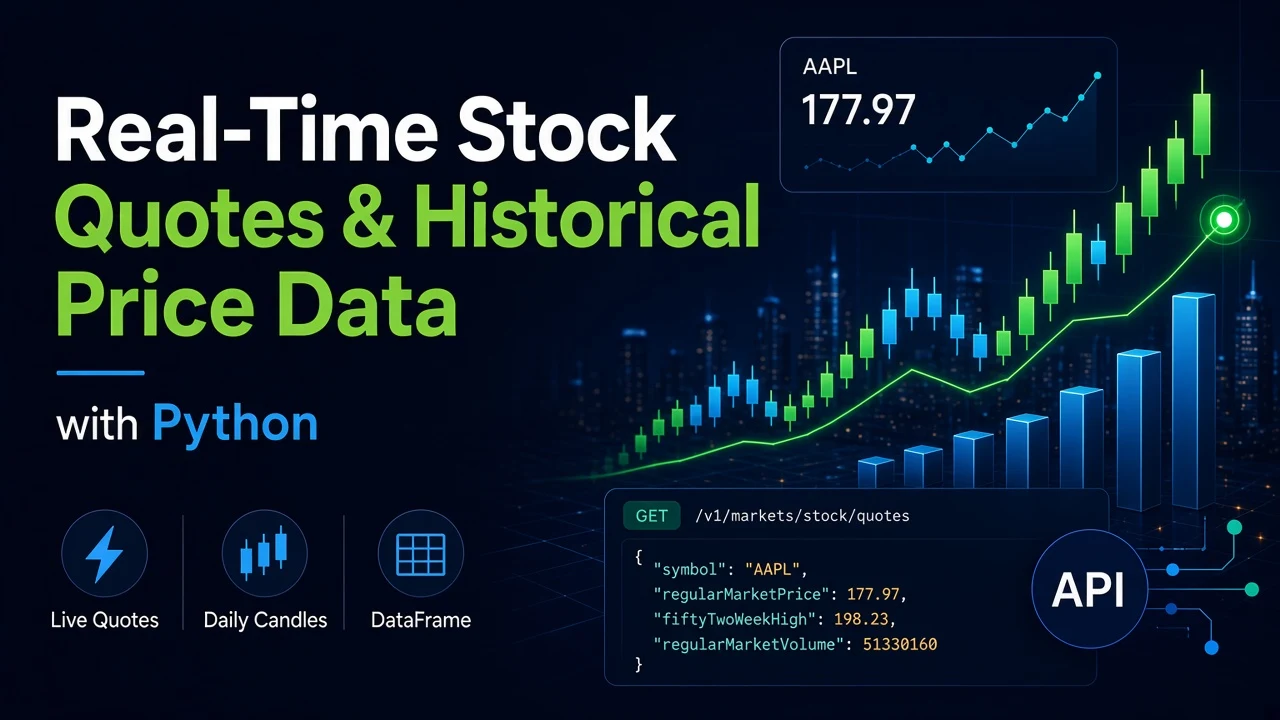
Every trading project starts the same way. You need today's price and a few years of price history. Then you can chart it, backtest it, or feed it into a model.
Getting there the hard way is slow. Copying numbers from a quote page breaks the day the page changes. Scraping gets blocked. Spreadsheet formulas lag and cap out. Free feeds often hand you one format for live prices and another for history, so you write two parsers before you write any logic.
SteadyAPI gives you both as JSON, behind one key. In this guide you will fetch live quotes for a watchlist, pull daily OHLCV candles into a pandas DataFrame, and combine them in one short script.
Prerequisites
- A SteadyAPI account and API key from steadyapi.com. The Free plan ($0, no credit card) covers every call in this guide.
- Python 3.8+ with
requestsandpandasinstalled. - Basic REST knowledge.
The endpoints you will use
- Latest quotes, up to 200 symbols:
GET /v1/markets/stock/quotes(weight 2) - Real-time quote with bid, ask and market status:
GET /v1/markets/quote(weight 1) - OHLCV candles, oldest first:
GET /v2/markets/stock/history(weight 1)
All three live under https://api.steadyapi.com. Authenticate with an Authorization: Bearer header. Copy the exact request for your language from the docs.
Step 1: Fetch quotes for a watchlist
Start with a small client that handles auth and errors in one place.
import requests

API_KEY = "YOUR_STEADYAPI_KEY"
BASE = "https://api.steadyapi.com"
HEADERS = {"Authorization": f"Bearer {API_KEY}"}


def get(path, **params):
    r = requests.get(f"{BASE}{path}", headers=HEADERS, params=params, timeout=30)
    r.raise_for_status()
    data = r.json()
    if data.get("success") is False:
        raise RuntimeError(data.get("message", "Request failed"))
    return data
The quotes endpoint takes a comma-separated ticker list. One call covers the whole watchlist.
def get_quotes(symbols):
    data = get("/v1/markets/stock/quotes", ticker=",".join(symbols))
    return {q["symbol"]: q for q in data["body"]}


quotes = get_quotes(["AAPL", "TSLA", "MSFT"])
for sym, q in quotes.items():
    print(
        f'{sym:<6} {q["regularMarketPrice"]:>9.2f}  '
        f'{q["regularMarketChangePercent"]:+.2f}%  vol {q["regularMarketVolume"]:,}'
    )
Each item in body is one symbol. A trimmed example, with values from the docs sample:
{
  "symbol": "AAPL",
  "shortName": "Apple Inc.",
  "marketState": "POSTPOST",
  "regularMarketPrice": 177.97,
  "regularMarketChangePercent": -0.1234644,
  "regularMarketVolume": 51330160,
  "fiftyTwoWeekLow": 124.17,
  "fiftyTwoWeekHigh": 198.23,
  "preMarketPrice": null,
  "postMarketPrice": 178.43
}
Pre-market and post-market fields are always present. They are null when there is no extended-hours data, so check for None before you do math on them.
Need bid, ask and market status for one symbol? Call GET /v1/markets/quote with ticker and type=STOCKS. Its values come back as display strings such as "$194.83", so strip the symbols before you convert them.
Step 2: Pull daily history into pandas
The v2 history endpoint returns a flat list of candles, oldest first. That maps straight onto a DataFrame.
import pandas as pd


def get_history(symbol, interval="1d", limit=1000):
    data = get(
        "/v2/markets/stock/history",
        ticker=symbol, interval=interval, limit=limit,
    )
    df = pd.DataFrame(data["body"])
    df["timestamp"] = pd.to_datetime(df["timestamp"])
    return df.set_index("timestamp")


df = get_history("AAPL")
print(df.tail())
Key parameters:
interval:1m,2m,3m,4m,5m,15m,30m,1h,2h,4h,1d,1wk,1mo, or1qty.limit: 1 to 1000 candles. The default is 640.- One symbol per request. A comma-separated list returns an error.
With interval=1d, limit=1000 is roughly four years of trading days. Each candle looks like this (sample shown at a 2-minute interval; daily candles have the same fields):
{
  "timestamp": "2025-06-04 15:50",
  "timestamp_unix": 1749066600,
  "open": 203.09,
  "high": 203.09,
  "low": 202.79,
  "close": 202.84,
  "volume": 185027
}
timestamp is in New York time. timestamp_unix is a Unix timestamp. Use whichever fits your pipeline, but do not mix them.
If you want a fixed five-year daily window, GET /v1/markets/stock/history?interval=1d returns it. That response is an object keyed by Unix timestamp, not a list.
Step 3: Combine live and historical data
Now compare today's price with the recent trend.
symbol = "AAPL"
df = get_history(symbol)
df["sma20"] = df["close"].rolling(20).mean()
df["daily_return"] = df["close"].pct_change()

live = get_quotes([symbol])[symbol]["regularMarketPrice"]
sma20 = df["sma20"].iloc[-1]

print(f"{symbol}: live {live:.2f} vs 20-day average {sma20:.2f}")
print(f"Above average: {live > sma20}")

df.to_csv(f"{symbol.lower()}_daily.csv")
You now have a CSV you can chart, backtest against, or load into a database.
Best practices
- Batch your quotes. One quotes call can carry up to 200 symbols. Fifty single-symbol calls cost far more than one batched call.
- Cache history. Past daily candles do not change. Save them to disk or a database, and on later runs request only the last few candles (
limit=5) to append. - Check
successin the body. A bad symbol or an empty result can return JSON like{"success": false, "message": "No data returned"}. The client above raises on it. HTTP status alone is not enough. - Mind the quota. Only 200 responses count toward it. On the Free plan you get 500 requests a month, capped at 20 a day, so cache aggressively. The standard rate limit is 10 requests per second per account.
- Handle time zones once. Convert history timestamps to the zone you need at load time, not in every function.
Bonus: ask it in plain English
You can connect Claude Code, Cursor, VS Code, or any MCP client to https://api.steadyapi.com/mcp with your API key. Then you can ask for "AAPL's last 30 daily closes" in chat and skip the script for one-off lookups.
Conclusion
You pulled live quotes for a watchlist, loaded multi-year daily candles into pandas, and compared the two in a short script that saves its output to CSV.
Create a free account at steadyapi.com (no card required) and copy your API key. Then browse the API documentation for the full parameter list and ready-made examples in cURL, JavaScript, PHP, and Python.