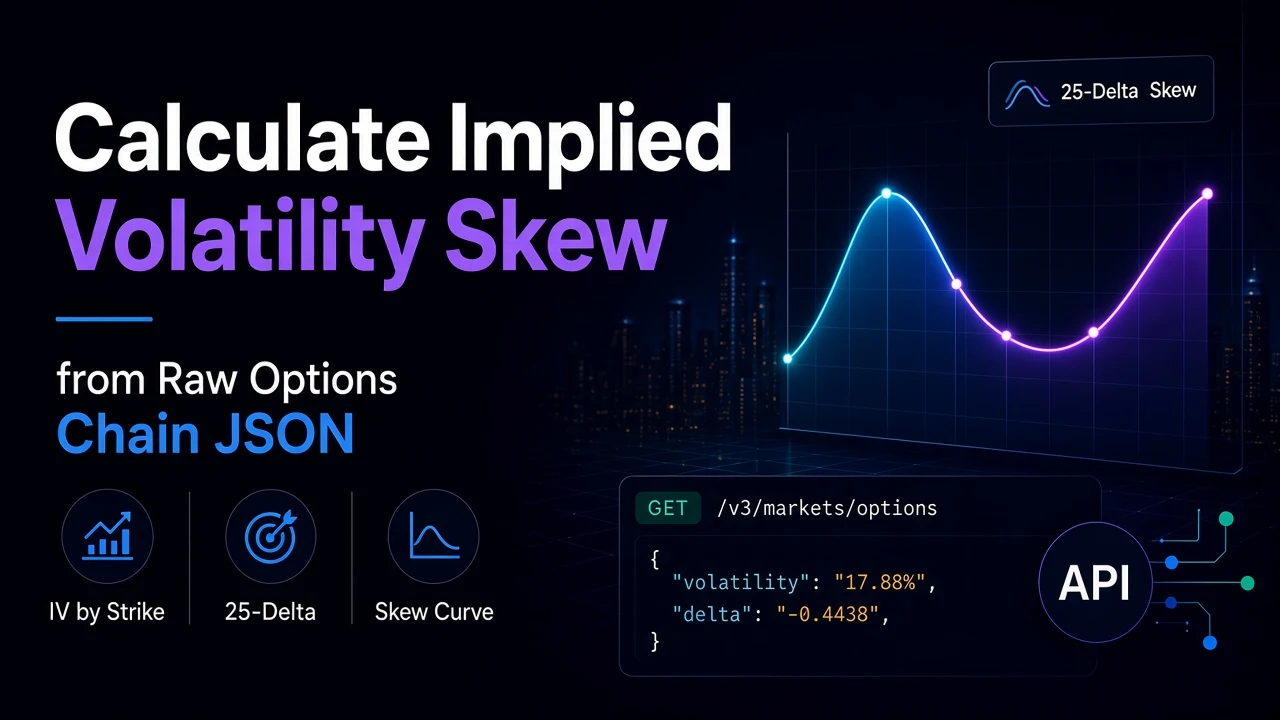
Implied volatility is not one number per stock. Each strike on an options chain has its own. Plot them against strike and you get a curve, usually a smile or a smirk. Its slope is the skew, and it tells you how much more the market pays for downside protection than for upside.
You do not need a terminal to see it. The options chain endpoint returns implied volatility for every contract in the chain. A page of pandas turns it into a skew number you can track, alert on, or feed into a model.
This guide measures skew three ways from one chain: at-the-money volatility, the 25-delta skew, and the skew across several expirations. For the basics of loading a chain, see Building an Options Chain Analyzer.
Prerequisites
- A SteadyAPI account and API key from steadyapi.com. The Free plan excludes the Options Data API, so you need a paid plan (Starter and up).
- Python 3.8+ with
requests,pandasandnumpy. - A little options vocabulary: delta, strike, implied volatility.
What the API gives you
GET https://api.steadyapi.com/v3/markets/options?ticker=SPY&expiration=2025-06-20The response has Call and Put lists. Every contract carries strikePrice, bidPrice, openInterest, volatility (implied volatility) and delta, all as strings. Here is a trimmed put from the docs sample:
{
  "strikePrice": "590.00",
  "bidPrice": "3.21",
  "openInterest": "7,496",
  "volatility": "17.88%",
  "delta": "-0.4438",
  "optionType": "Put",
  "daysToExpiration": "3"
}
meta.expirations lists the available weekly and monthly dates. Each call has a weight of 2. See the endpoint docs.
Delta is the useful axis here. A 25-delta put is the same distance out of the money, in risk terms, whatever the stock's price or volatility. It makes skew comparable across tickers and dates.
Step 1: Load and clean the chain
import numpy as np
import pandas as pd
import requests

API_KEY = "YOUR_STEADYAPI_KEY"
HEADERS = {"Authorization": f"Bearer {API_KEY}"}
BASE = "https://api.steadyapi.com"


def get(path, **params):
    r = requests.get(f"{BASE}{path}", headers=HEADERS, params=params, timeout=30)
    r.raise_for_status()
    data = r.json()
    if data.get("success") is False:
        raise RuntimeError(data.get("message", "Request failed"))
    return data


def num(value):
    try:
        return float(str(value).replace(",", "").replace("%", "").replace("+", ""))
    except ValueError:
        return None


def frames(data):
    out = []
    for side in ("Call", "Put"):
        df = pd.DataFrame(data["body"][side])
        for col in ("strikePrice", "bidPrice", "openInterest", "volatility", "delta"):
            df[col] = df[col].map(num)
        # Keep contracts with a real market behind the quote
        df = df[(df.bidPrice > 0) & (df.openInterest > 0)]
        out.append(df.dropna(subset=["volatility", "delta"]))
    return out  # calls, puts
The filter matters. Contracts with no bid or no open interest carry stale or meaningless implied volatilities, and one bad point can ruin an interpolation.
Step 2: Measure the skew
def iv_at_delta(df, target):
    d = df.sort_values("delta")
    if not d["delta"].min() <= target <= d["delta"].max():
        return None  # chain does not reach this delta
    return float(np.interp(target, d["delta"], d["volatility"]))


def skew(ticker, spot, expiration=None):
    params = {"ticker": ticker}
    if expiration:
        params["expiration"] = expiration
    data = get("/v3/markets/options", **params)
    calls, puts = frames(data)

    atm_call = np.interp(spot, calls.sort_values("strikePrice")["strikePrice"],
                         calls.sort_values("strikePrice")["volatility"])
    atm_put = np.interp(spot, puts.sort_values("strikePrice")["strikePrice"],
                        puts.sort_values("strikePrice")["volatility"])
    atm = (atm_call + atm_put) / 2

    put25 = iv_at_delta(puts, -0.25)
    call25 = iv_at_delta(calls, 0.25)
    if put25 is None or call25 is None:
        return None
    return {"atm_iv": atm, "put25": put25, "call25": call25,
            "skew": put25 - call25, "skew_pct_of_atm": (put25 - call25) / atm * 100,
            "dte": calls["daysToExpiration"].iloc[0]}


spot = get("/v1/markets/stock/quotes", ticker="SPY")["body"][0]["regularMarketPrice"]
print(skew("SPY", spot))
Read the output like this. skew is the 25-delta put volatility minus the 25-delta call volatility, in volatility points. A positive number means puts are priced richer than calls, which is the normal shape for stock indexes. skew_pct_of_atm scales it by overall volatility, so you can compare a calm ticker with a wild one.
The quotes call supplies the spot price used for the at-the-money reading. It costs 2 requests, and you only need it once per ticker.
Step 3: Look across expirations
Skew changes with time to expiry, so one expiration is a single slice. Loop over the next few monthly dates:
expirations = get("/v3/markets/options", ticker="SPY")["meta"]["expirations"]["monthly"][:4]

rows = []
for exp in expirations:
    s = skew("SPY", spot, exp)
    if s:
        rows.append({"expiration": exp, **s})

print(pd.DataFrame(rows).round(2).to_string(index=False))
That is about 12 requests: 2 for the expiration list, 2 for the spot price, and 2 for each of the four chains.
Reading the result
- Watch it change. Skew can steepen when investors want protection ahead of an event. Track the number daily and see how it moves.
- Compare like with like. Use the same delta, the same days to expiry, and the same ticker through time. Do not compare a weekly with a monthly.
- A flat skew is information too. It means the market is not paying up for protection.
- Treat it as a signal, not a verdict. Skew describes pricing. It does not predict direction.
Best practices
- Filter thin contracts. Require a bid and open interest before you use a volatility.
- Do not extrapolate. The code returns
Nonewhen the chain does not reach 25 delta. Do not invent a value. - Store daily results. Append each run to a file or a table. A skew history is more useful than one reading.
- Check status and body. A 403 means your plan does not include options. A failed lookup can return HTTP 200 with
successset tofalse. Only 200 responses count toward your quota. - Mind the rate limit. The standard limit is 10 requests per second per account. Loop expirations one after another.
- Know the other fields. Each contract also carries
impliedVolatilityRank1y, and the options endpoints include IV rank and highest-IV lists. Use them when you need a rank instead of a shape.
Bonus: ask it in plain English
You can connect Claude Code, Cursor, VS Code, or any MCP client to https://api.steadyapi.com/mcp with your API key. Then ask "how steep is SPY's 25-delta skew for the next monthly expiration?" in chat for a first look, and script the ones you want to track.
Conclusion
You loaded a raw options chain, cleaned it, interpolated implied volatility at the money and at 25 delta, and compared skew across expirations. All of it came from one endpoint and a handful of requests.
Create a free account at steadyapi.com (no card required), upgrade to a paid plan for options data, and read the API documentation for every parameter and ready-made examples in cURL, JavaScript, PHP, and Python.