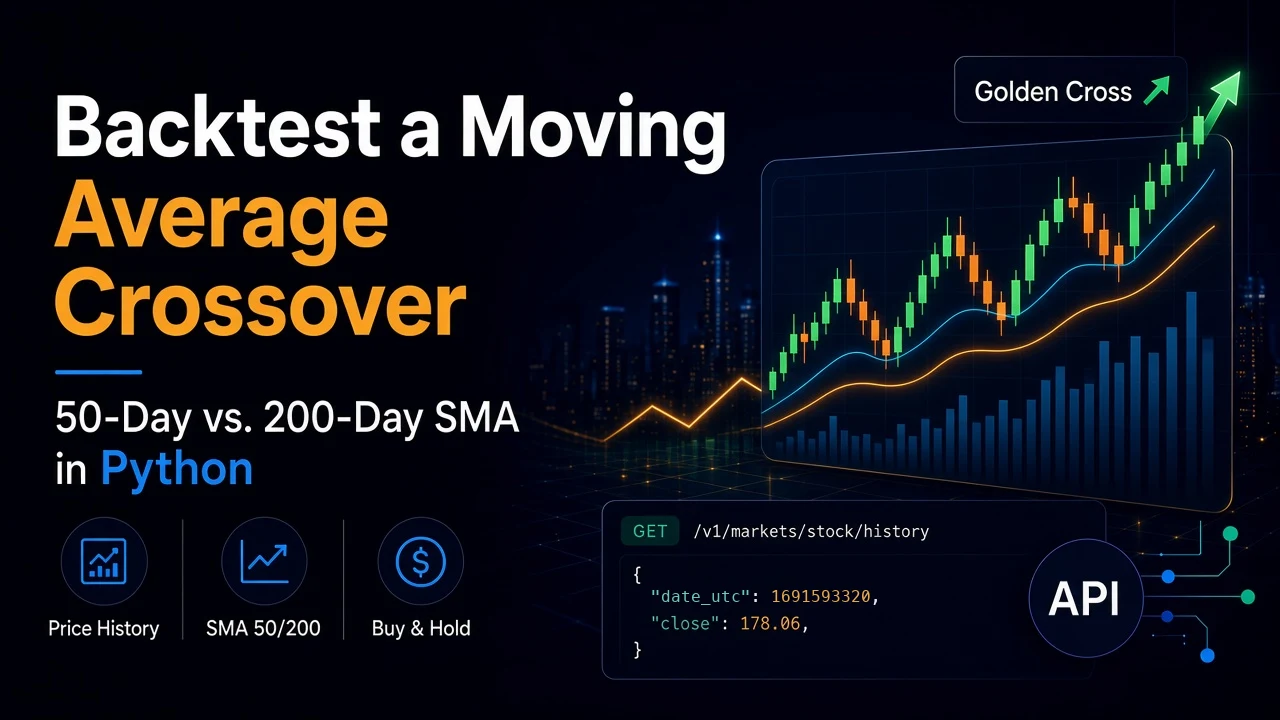
The moving average crossover is the first strategy most people backtest. Buy when the 50-day average rises above the 200-day average. Step aside when it falls back below. It is simple enough to code in an afternoon, and it teaches the mistakes that ruin most backtests.
You need two things: clean daily prices and about 40 lines of pandas. This guide pulls five years of daily bars from SteadyAPI, calculates both averages, runs the strategy without peeking at tomorrow's price, and compares it to simply holding the stock.
This is an educational exercise, not financial advice. A backtest shows what would have happened in the past, not what will happen next.
Prerequisites
- A SteadyAPI account and API key from steadyapi.com. The Free plan ($0, no credit card) is enough, because the whole backtest uses one request.
- Python 3.8+ with
requestsandpandas.
Step 1: Pull the price history
GET https://api.steadyapi.com/v1/markets/stock/history?ticker=AAPL&interval=1dThe 1d interval returns daily candles for the last 5 years. That is about 1,250 bars. Each call has a weight of 1. The body is keyed by Unix timestamp, and each candle has date_utc, open, high, low, close and volume. It also includes adjclose when one is available. See the endpoint docs.
import requests
import pandas as pd

API_KEY = "YOUR_STEADYAPI_KEY"
URL = "https://api.steadyapi.com/v1/markets/stock/history"
HEADERS = {"Authorization": f"Bearer {API_KEY}"}


def load_prices(ticker):
    r = requests.get(URL, headers=HEADERS,
                     params={"ticker": ticker, "interval": "1d"}, timeout=30)
    r.raise_for_status()
    data = r.json()
    if data.get("success") is False:
        raise RuntimeError(data.get("message", "Request failed"))

    body = data["body"]
    body.pop("events", None)  # only present if you ask for dividends and splits
    df = pd.DataFrame.from_dict(body, orient="index")
    df.index = pd.to_datetime(df["date_utc"], unit="s").dt.normalize()
    df = df.sort_index()
    # Adjusted close accounts for splits and dividends. Fall back to close.
    price = df["adjclose"] if "adjclose" in df else df["close"]
    return price.dropna()
A candle has this shape, with values from the docs sample:
{
  "date_utc": 1691593320,
  "open": 177.88,
  "high": 178.07,
  "low": 177.86,
  "close": 178.06,
  "volume": 147707
}
Use the adjusted close for backtests. A 4-for-1 split looks like a 75% crash in raw prices and would trigger your signal for the wrong reason.
Step 2: Calculate the averages and the signal
price = load_prices("AAPL")

sma50 = price.rolling(50).mean()
sma200 = price.rolling(200).mean()

# 1 when the fast average is above the slow one, otherwise 0
signal = (sma50 > sma200).astype(int)
The 200-day average needs 200 bars, so the first 199 rows have no value. With about 1,250 bars, you can test roughly four years.
Step 3: Run the strategy without peeking
This line is the most important one in the script:
position = signal.shift(1).fillna(0)A crossover is only known at the close. If you act on the same day's return, you are trading on information you did not have yet. Shifting by one day means the signal is acted on the next day.
returns = price.pct_change().fillna(0)

COST = 0.001  # 0.1% charged each time the position changes
trades = position.diff().abs().fillna(0)
strategy = position * returns - trades * COST

# Only compare once the 200-day average exists
ready = sma200.notna()
strategy, returns, trades = strategy[ready], returns[ready], trades[ready]
Step 4: Compare it to buy and hold
def stats(daily, label):
    curve = (1 + daily).cumprod()
    years = len(daily) / 252
    total = curve.iloc[-1] - 1
    cagr = curve.iloc[-1] ** (1 / years) - 1
    drawdown = (curve / curve.cummax() - 1).min()
    print(f"{label:12} total {total:7.1%}  CAGR {cagr:6.1%}  max drawdown {drawdown:7.1%}")


stats(strategy, "Crossover")
stats(returns, "Buy and hold")
print("Position changes:", int(trades.sum()))
Read the three numbers together. A strategy often earns less than buy and hold in a rising market. Its value can show up in a lower maximum drawdown, because it sits in cash during long declines. Judge it on both.
Best practices
- Shift the signal. Without the one-day shift, results look better than they could ever be in practice.
- Include costs. Even a small cost per trade changes the picture for strategies that switch often.
- Do not trust one ticker. A crossover trades only a few times in four years. Run several tickers and several periods before you believe a result.
- Cache the data. The history does not change. Save the DataFrame to a file and reload it while you experiment. It saves requests, and you stay well inside your plan.
- Check status and body. Failed lookups can return HTTP 200 with
successset tofalse. Only 200 responses count toward your quota. - Cross-check your math. The SMA indicator endpoint (weight 2) returns the latest 50 averaged values. Use it to spot-check your latest value.
- Mind the rate limit. The standard limit is 10 requests per second per account. A loop over a watchlist should pause between calls.
Bonus: ask it in plain English
You can connect Claude Code, Cursor, VS Code, or any MCP client to https://api.steadyapi.com/mcp with your API key. Then ask for a quick 50/200 crossover check on a ticker in chat, and write the script only for the ideas that survive.
Conclusion
You pulled five years of daily prices in one request, built a 50/200-day crossover, ran it without lookahead, and compared the result to buy and hold. The same structure works for any signal: change the two lines that define it.
Create a free account at steadyapi.com (no card required) and copy your API key. Then browse the API documentation for every parameter and ready-made examples in cURL, JavaScript, PHP, and Python.