A spreadsheet is a fine way to track a portfolio until it is not. Every price is a formula in a cell. Add enough rows and it gets slow. Share it, and someone breaks a formula. Try to run it from a script, and you find out a spreadsheet is a poor place to keep logic.
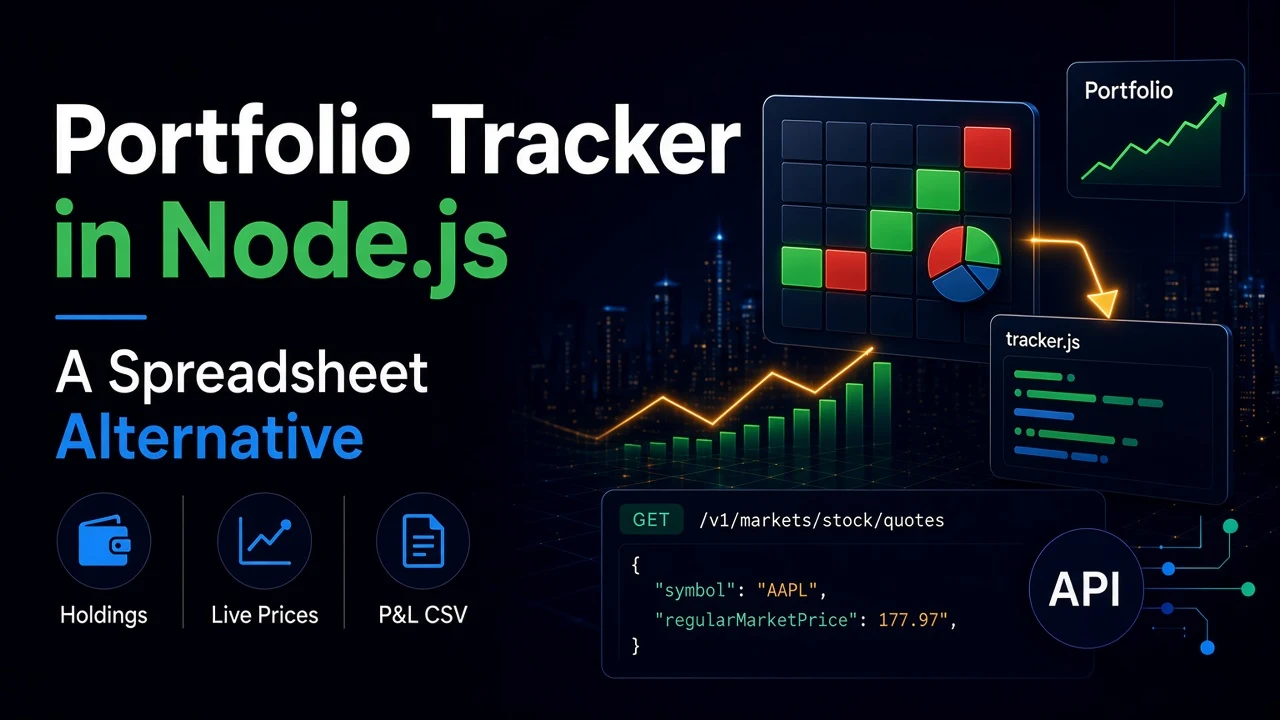
You can keep the spreadsheet for viewing and move the numbers into code. A Node.js script reads a list of holdings, fetches every price in one request, works out value and profit and loss, and writes a CSV file that opens in Google Sheets or Excel.
This guide builds that script with no dependencies. It uses Node's built-in fetch and fs, and SteadyAPI's stock quotes endpoint.
Prerequisites
- A SteadyAPI account and API key from steadyapi.com. The Free plan ($0, no credit card) is enough to build and test it.
- Node.js 18 or newer.
- Your holdings: ticker, shares, and average cost per share.
Step 1: Describe your holdings
Create holdings.json:
[
  { "ticker": "AAPL", "shares": 25, "cost": 150.0 },
  { "ticker": "MSFT", "shares": 10, "cost": 310.5 },
  { "ticker": "VOO", "shares": 12, "cost": 395.0 },
  { "ticker": "BTC-USD", "shares": 0.05, "cost": 42000 }
]
The quotes endpoint accepts stocks, ETFs, mutual funds, indices (prefix with ^), futures, forex and crypto in one request. Crypto uses the BTC-USD format. The docs list the formats for each asset type in the quotes endpoint reference.
Step 2: Fetch all prices in one call
const fs = require("fs");

const API_KEY = process.env.STEADYAPI_KEY; // keep the key out of the file
const ENDPOINT = "https://api.steadyapi.com/v1/markets/stock/quotes";

async function fetchQuotes(tickers) {
  const res = await fetch(`${ENDPOINT}?ticker=${tickers.join(",")}`, {
    headers: { Authorization: `Bearer ${API_KEY}` },
    signal: AbortSignal.timeout(20_000),
  });
  if (!res.ok) throw new Error(`HTTP ${res.status}`);
  const data = await res.json();
  if (data.success === false) throw new Error(data.message ?? "Request failed");
  return Object.fromEntries(data.body.map((q) => [q.symbol, q]));
}
One call returns up to 200 symbols and counts as 2 requests. Fifty holdings still cost one call. Each item in body has numbers, not strings. The fields you need are regularMarketPrice, regularMarketChange, regularMarketChangePercent and currency.
Step 3: Compute value and profit and loss
async function main() {
  const holdings = JSON.parse(fs.readFileSync("holdings.json", "utf8"));
  const quotes = await fetchQuotes(holdings.map((h) => h.ticker));

  const rows = [];
  for (const h of holdings) {
    const q = quotes[h.ticker];
    if (!q) {
      console.warn(`No quote returned for ${h.ticker}, skipping`);
      continue;
    }
    const value = h.shares * q.regularMarketPrice;
    const costBasis = h.shares * h.cost;
    rows.push({
      ticker: h.ticker,
      currency: q.currency,
      shares: h.shares,
      price: q.regularMarketPrice,
      dayChange: h.shares * q.regularMarketChange,
      value,
      pnl: value - costBasis,
      pnlPct: ((value - costBasis) / costBasis) * 100,
    });
  }
  return rows;
}
A symbol that the API does not return is skipped with a warning. Check your tickers when you see one.
Step 4: Print totals and write the CSV
Add up totals per currency. Adding dollars to euros gives a meaningless number.
function report(rows) {
  const totals = {};
  for (const r of rows) {
    const t = (totals[r.currency] ??= { value: 0, pnl: 0, dayChange: 0 });
    t.value += r.value;
    t.pnl += r.pnl;
    t.dayChange += r.dayChange;
  }

  for (const r of rows) {
    console.log(
      `${r.ticker.padEnd(8)} ${r.price.toFixed(2).padStart(10)} ` +
      `${r.value.toFixed(2).padStart(12)} ${r.pnl.toFixed(2).padStart(10)} (${r.pnlPct.toFixed(1)}%)`
    );
  }
  for (const [cur, t] of Object.entries(totals)) {
    console.log(`\n${cur}: value ${t.value.toFixed(2)}, P&L ${t.pnl.toFixed(2)}, today ${t.dayChange.toFixed(2)}`);
  }

  const header = "ticker,currency,shares,price,day_change,value,pnl,pnl_pct";
  const lines = rows.map((r) =>
    [r.ticker, r.currency, r.shares, r.price, r.dayChange.toFixed(2),
     r.value.toFixed(2), r.pnl.toFixed(2), r.pnlPct.toFixed(2)].join(",")
  );
  fs.writeFileSync("portfolio.csv", [header, ...lines].join("\n"));
}

main().then(report).catch((err) => {
  console.error("Failed:", err.message);
  process.exit(1);
});
Run it with STEADYAPI_KEY=YOUR_STEADYAPI_KEY node tracker.js. Import portfolio.csv into a sheet, or open it directly.
Step 5: Run it on a schedule
Refresh every weekday afternoon with cron, and keep the CSV where your sheet can reach it. Set the key once at the top of your crontab:
STEADYAPI_KEY=YOUR_STEADYAPI_KEY
0 17 * * 1-5 /usr/bin/node /path/to/tracker.js
One refresh is 2 requests. Four refreshes a day for a month is a few hundred requests, so even the Free plan (500 requests a month, capped at 20 a day) covers a light schedule. For live updates through the session, see Python vs. JavaScript: Fetching Live Market Data Without WebSockets for how to size the polling interval to your plan.
Best practices
- Keep the key out of the script. Read it from an environment variable. Do not commit it to Git.
- Check status and body. A bad request returns an HTTP error. A failed lookup can return HTTP 200 with
successset tofalse. Only 200 responses count toward your quota. - Batch, always. Never loop one ticker per request. One call for the whole portfolio is the cheapest design, and it stays well under the 10 requests per second limit.
- Store history. Append each run to a dated file. Then you can chart value over time, which a live formula cannot do.
- Handle splits yourself. The price feed does not rewrite your share count. Update
holdings.jsonwhen a split happens.
Bonus: ask it in plain English
You can connect Claude Code, Cursor, VS Code, or any MCP client to https://api.steadyapi.com/mcp with your API key. Then ask "what is my portfolio worth right now?" and paste your holdings, for a quick answer without running the script.
Conclusion
You replaced a column of spreadsheet formulas with a short Node.js script. It fetches every price in one request, calculates value, day change and profit and loss, and writes a CSV your spreadsheet can read.
Create a free account at steadyapi.com (no card required) and copy your API key. Then browse the API documentation for every parameter and ready-made examples in cURL, JavaScript, PHP, and Python.