Most of the news that moves a stock lands outside the 9:30 to 4:00 session. Earnings reports come before the open or just after the close. By the time the opening bell rings, the big moves have already happened.
A watchlist dashboard that only shows regular-session prices misses all of it. You need to know two things before the open: what is moving across the whole market, and what happened to the stocks you hold.
SteadyAPI answers the first with one call to the movers endpoint. It answers the second with the pre-market and post-market fields on the quotes endpoint. This guide combines them with a market-status check so the same script works in pre-market, after hours and the regular session.
For the regular-session version, see How to Build a Market Movers Dashboard Using SteadyAPI.
Prerequisites
- A SteadyAPI account and API key from steadyapi.com. The Free plan ($0, no credit card) covers all three endpoints.
- Python 3.8+ with
requests. - A watchlist of tickers.
The three endpoints
GET /v2/markets/market-info(weight 1) tells you which session it is: pre-market, open, after hours or closed. It takes no parameters.GET /v1/markets/movers?type=STOCKS(weight 1) returns the current session's movers for one asset class, in one response.typealso acceptsETF,MUTUALFUNDSandFUTURES.GET /v1/markets/stock/quotes?ticker=AAPL,MSFT(weight 2) returns the latest quote for up to 200 symbols, including pre-market and post-market fields.
Browse each in the docs: market info, movers and quotes.
Step 1: Find out which session it is
import requests

API_KEY = "YOUR_STEADYAPI_KEY"
BASE = "https://api.steadyapi.com"
HEADERS = {"Authorization": f"Bearer {API_KEY}"}


def get(path, **params):
    r = requests.get(f"{BASE}{path}", headers=HEADERS, params=params, timeout=30)
    r.raise_for_status()
    data = r.json()
    if data.get("success") is False:
        raise RuntimeError(data.get("message", "Request failed"))
    return data


def session():
    info = get("/v2/markets/market-info")["body"]
    label = info["marketIndicator"].lower()  # for example "after hours"
    if "pre" in label:
        return "pre"
    if "after" in label:
        return "after"
    return label
The response also carries preMarketOpeningTime, marketOpeningTime, afterHoursMarketOpeningTime, and the previousTradeDate and nextTradeDate. Here is a trimmed sample:
{
  "marketIndicator": "After Hours",
  "marketCountDown": "Market Opens in 2D 14H 5M",
  "preMarketOpeningTime": "Feb 2, 2024 04:00 AM ET",
  "marketOpeningTime": "Feb 2, 2024 09:30 AM ET",
  "afterHoursMarketOpeningTime": "Feb 2, 2024 04:00 PM ET",
  "previousTradeDate": "Feb 1, 2024",
  "nextTradeDate": "Feb 5, 2024"
}
Match on a piece of the text, as above. Do not depend on the exact casing.
Step 2: Pull market-wide movers
One call returns four tables: MostActiveByShareVolume, MostAdvanced, MostDeclined and MostActiveByDollarVolume. Each has a dataAsOf timestamp and a list of rows.
def num(value):
    """'$6.25' -> 6.25, '+48.1%' -> 48.1, '102,855,698' -> 102855698."""
    try:
        return float(str(value).replace("$", "").replace(",", "").replace("%", "").replace("+", ""))
    except ValueError:
        return None


movers = get("/v1/markets/movers", type="STOCKS")["body"]
print("Data as of:", movers["MostAdvanced"]["dataAsOf"])

active = {r["symbol"] for r in movers["MostActiveByShareVolume"]["table"]["rows"]}


def top(table, limit=10, min_price=5):
    rows = [r for r in movers[table]["table"]["rows"]
            if (num(r["lastSalePrice"]) or 0) >= min_price]
    return rows[:limit]


for r in top("MostAdvanced"):
    flag = "  [high volume]" if r["symbol"] in active else ""
    print(f'{r["symbol"]:6} {r["lastSalePrice"]:>9} {r["change"]:>8}{flag}')
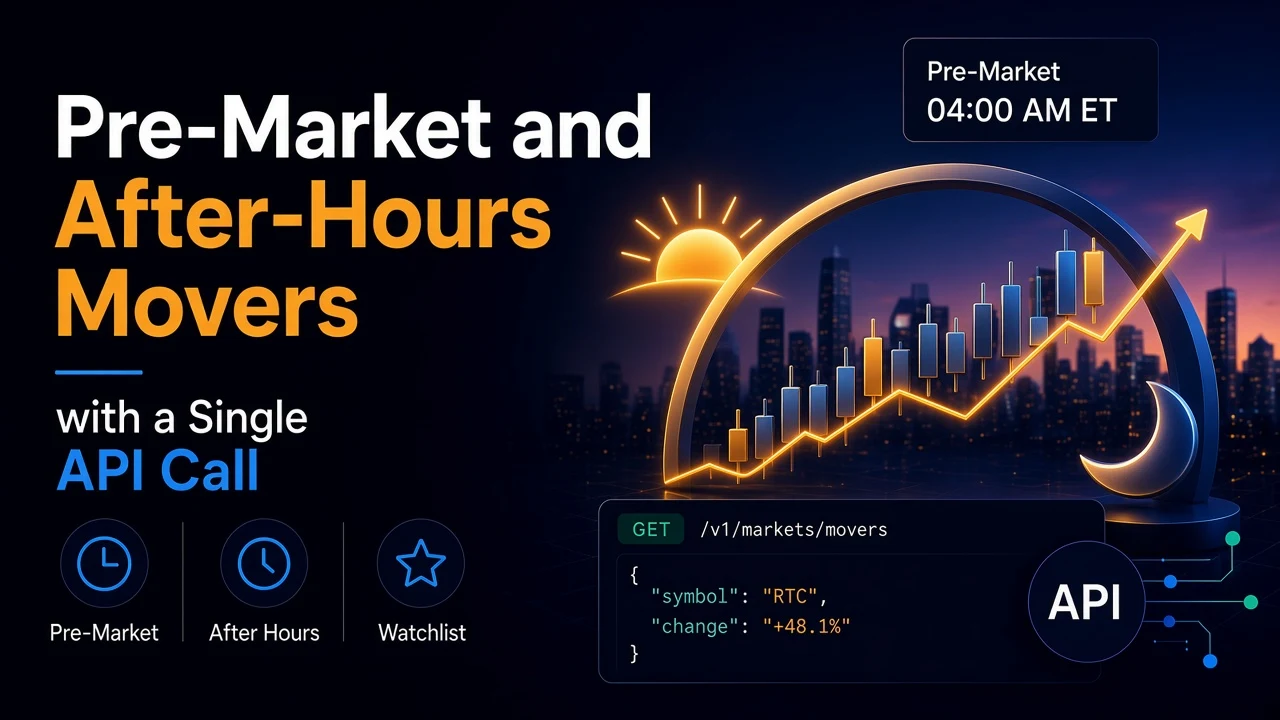
A trimmed row from MostAdvanced:
{
  "symbol": "RTC",
  "name": "Baijiayun Group Ltd",
  "lastSalePrice": "$6.25",
  "lastSaleChange": "+2.03",
  "change": "+48.1%",
  "deltaIndicator": "up"
}
In MostAdvanced and MostDeclined, change is the percent change. In MostActiveByShareVolume, it is the share volume. The dataAsOf line is your check on which session you are looking at. Print it, and do not assume.
Step 3: Show extended-hours moves for your watchlist
The quotes endpoint always includes preMarketPrice, preMarketChangePercent, postMarketPrice and postMarketChangePercent. The values are null when the stock has no extended-hours trade.
WATCHLIST = ["AAPL", "MSFT", "TSLA", "NVDA", "AMD"]


def extended_moves(which):
    quotes = get("/v1/markets/stock/quotes", ticker=",".join(WATCHLIST))["body"]
    prefix = "preMarket" if which == "pre" else "postMarket"
    rows = []
    for q in quotes:
        price, pct = q.get(f"{prefix}Price"), q.get(f"{prefix}ChangePercent")
        if price is None:
            continue
        rows.append((q["symbol"], q["regularMarketPrice"], price, pct))
    return sorted(rows, key=lambda r: abs(r[3]), reverse=True)


which = session()
if which in ("pre", "after"):
    for sym, regular, ext, pct in extended_moves(which):
        print(f"{sym:6} regular {regular:>8}  extended {ext:>8}  {pct:+.2f}%")
else:
    print("Regular session or closed. Use the regular-session fields.")
The percent values are plain numbers. A value of 0.258466 means +0.26%. Prices are numbers, not strings.
Putting it together
Run the script a few times around the open and close:
1. Call session(). It costs 1 request. 2. In pre-market or after hours, call movers (1 request) and quotes (2 requests) and print both views. 3. At the open, switch to the regular fields.
That is 4 requests per refresh. On the Free plan (500 requests a month, 20 a day) it is a few refreshes a day, so a paid plan suits anything that updates through the session.
Best practices
- Treat thin volume with suspicion. Extended-hours prices move on small trades. Compare movers to the
MostActiveByShareVolumelist, as above, and filter out low prices. - Do not trust
nullas zero. Anullpre-market price means no trade, not a flat price. Skip it. - Parse the strings. Movers rows return
$,%,+and commas. Use one helper everywhere. - Check status and body. Failed lookups can return HTTP 200 with
successset tofalse. Only 200 responses count toward your quota. - Cache per refresh. Call each endpoint once and serve the result to all users. Never call the API from browsers, because your key would be exposed.
- Stay under the rate limit. The standard limit is 10 requests per second per account.
Bonus: ask it in plain English
You can connect Claude Code, Cursor, VS Code, or any MCP client to https://api.steadyapi.com/mcp with your API key. Then ask "what is moving pre-market today, and how are NVDA and TSLA trading?" in chat before you script it.
Conclusion
You checked the market session, pulled market-wide movers in one call, and read pre-market and post-market moves for a watchlist. Together they give your dashboard a view of the moves that happen before and after the bell.
Create a free account at steadyapi.com (no card required) and copy your API key. Then browse the API documentation for every parameter and ready-made examples in cURL, JavaScript, PHP, and Python.